Crash-Proof Custom Agents
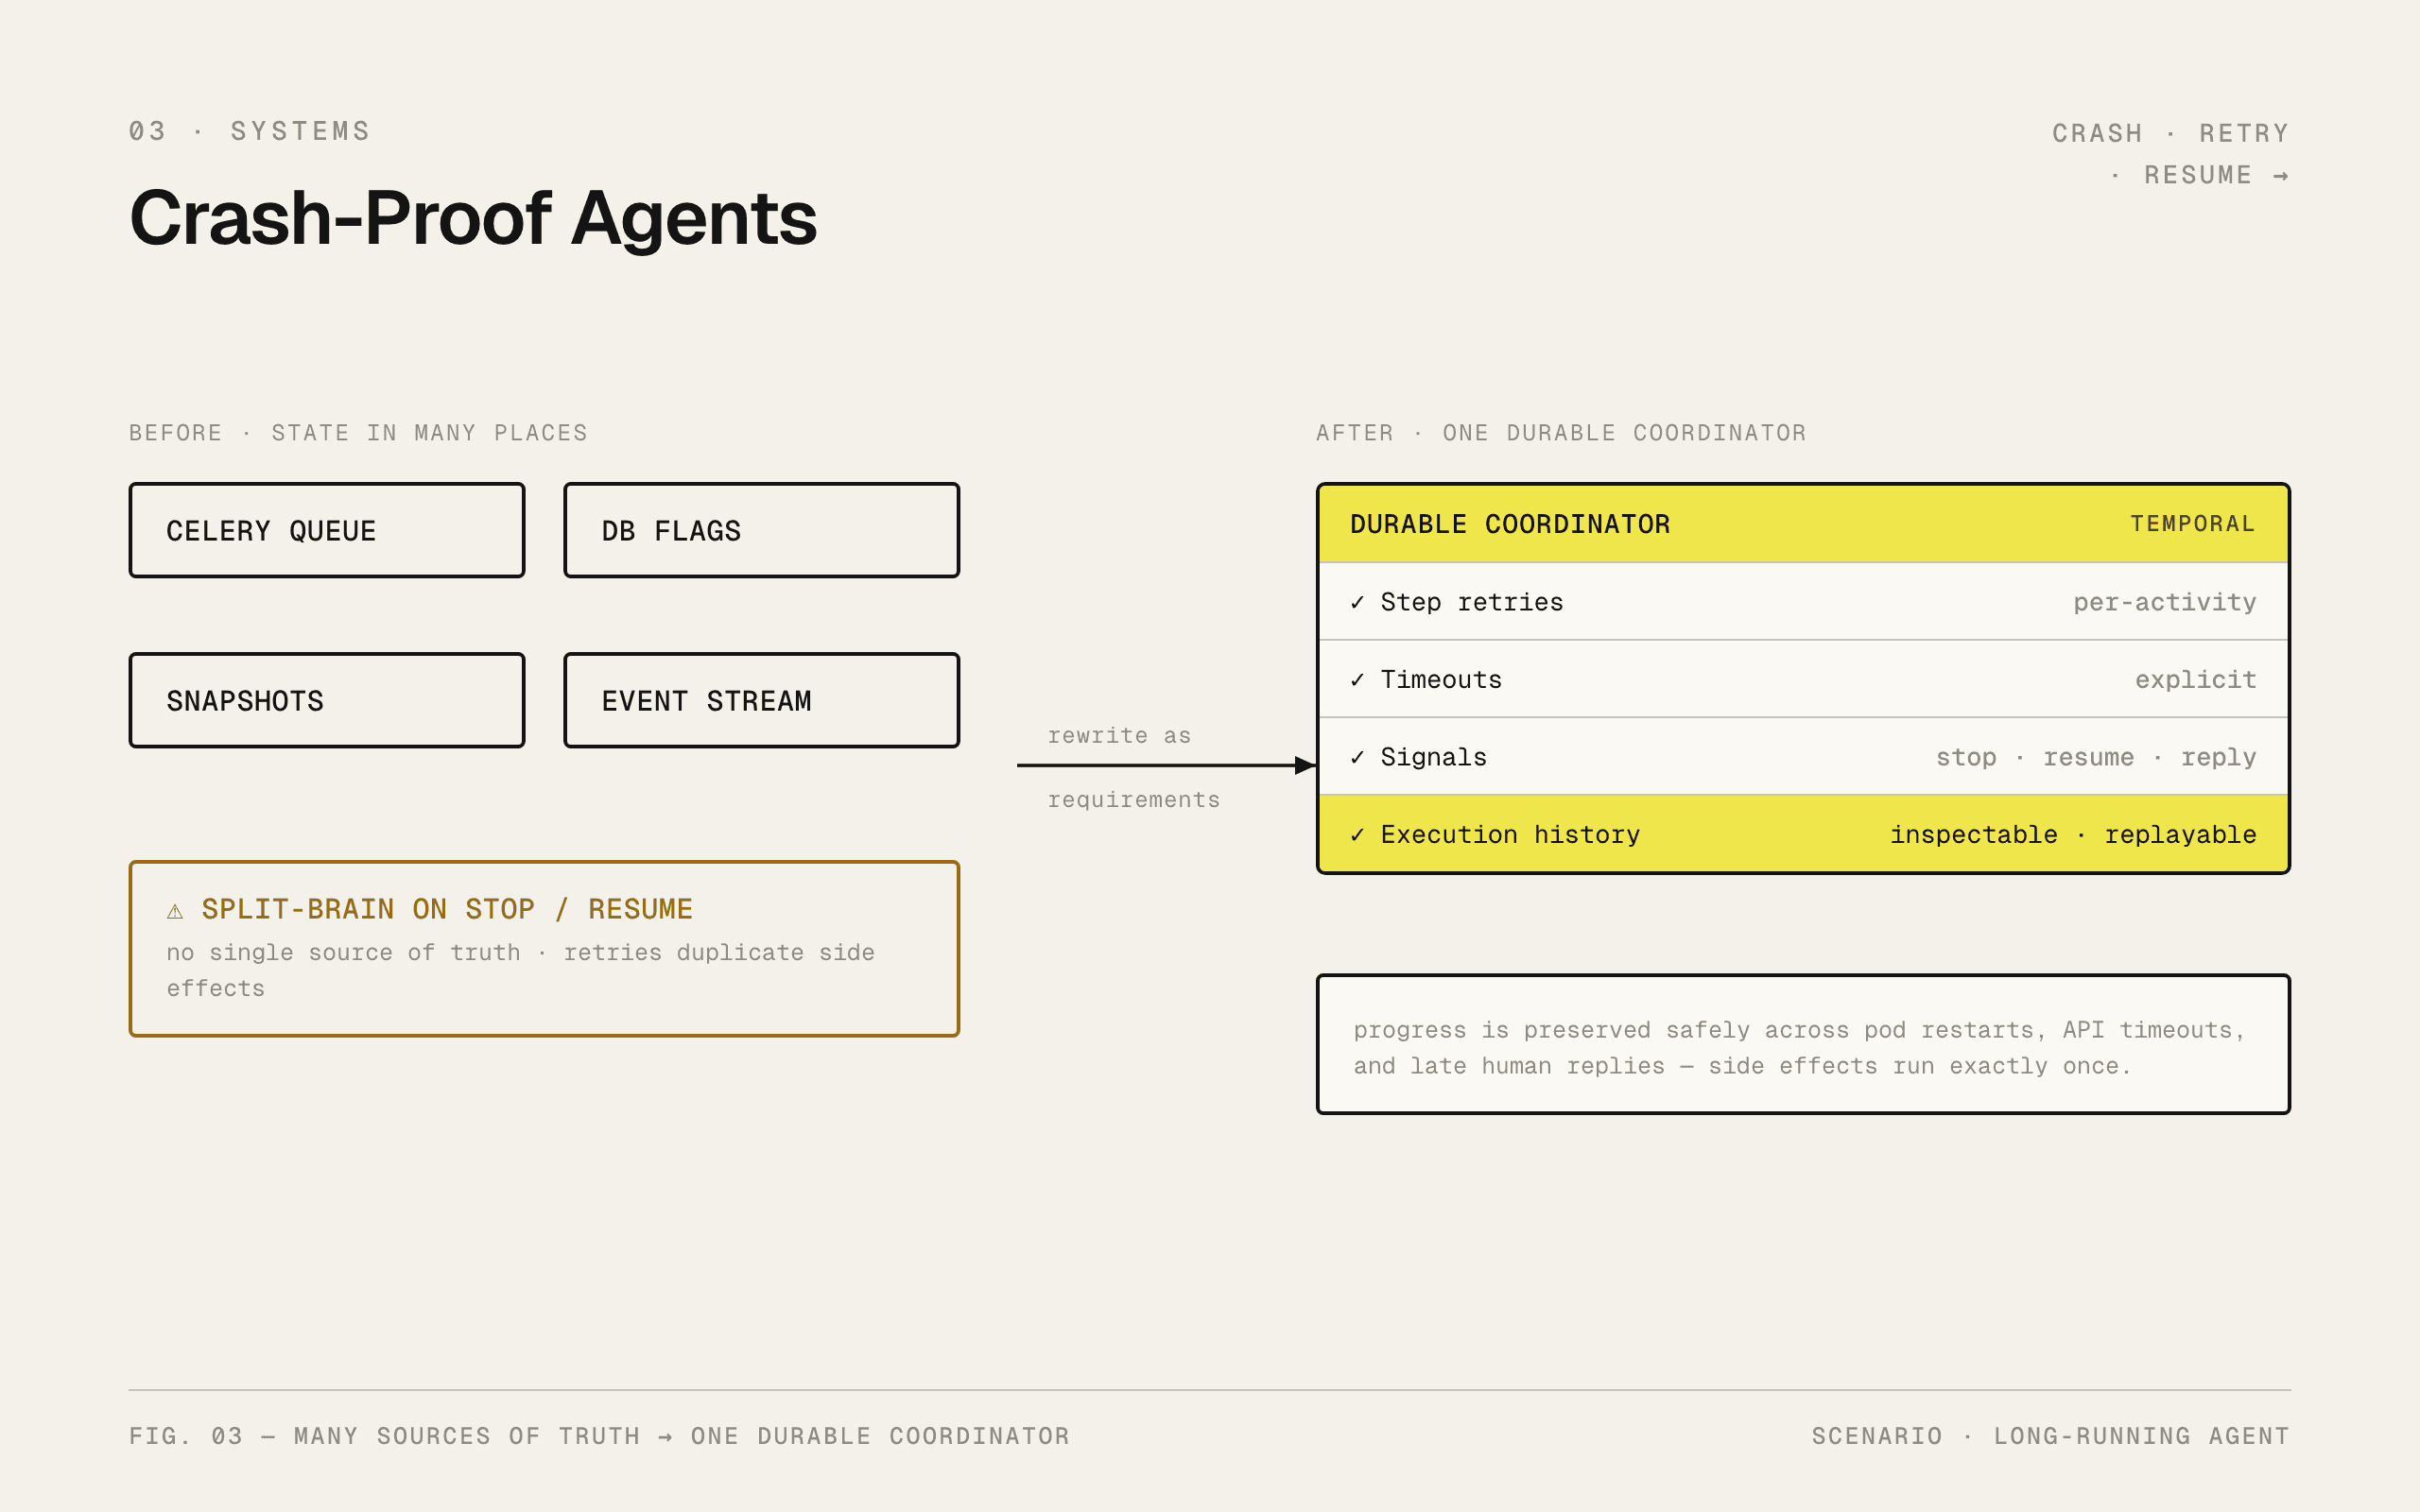
Shipping long-running agents with retries, stops, and durable state.
The Real Problem: Agents are Distributed Systems
Long-running agent runs fail for boring reasons: pods restart, external APIs time out, and humans reply late.
The hard part isn’t generating the next step, it’s preserving progress safely (without duplicating side effects) when failures happen mid-run.
This post focuses on durable execution (not a closed-loop self-improving system): what broke in our first approach, what we changed, and what got better.
This is an agent written in vanilla Python, no LangChain/LlamaIndex, no agent framework, no hosted agent runtime. The model can be “smart” and the run can still fail for boring distributed-systems reasons unless the coordinator is durable.
We had all the familiar ingredients:
- Interactions (user input / external events)
- Decisions (LLM decides what to do)
- Actions (tools, APIs, sub-agents)
- Memory update (context grows, plans evolve)
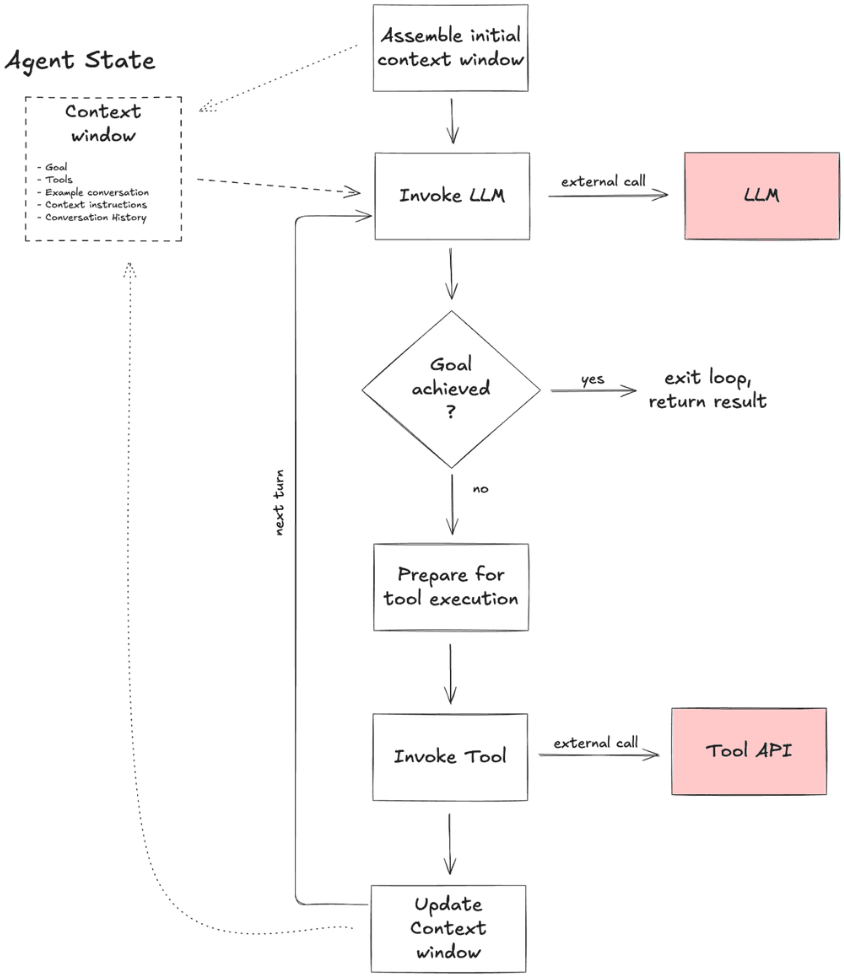
Even when the model output was fine, runs still failed due to flaky external calls and pod restarts.
This post is about the engineering work behind the failures that forced an architecture change, the design decisions that mattered, and the operational work (observability + tuning) that made it real.
Where We Started: Celery + DB flags + snapshots
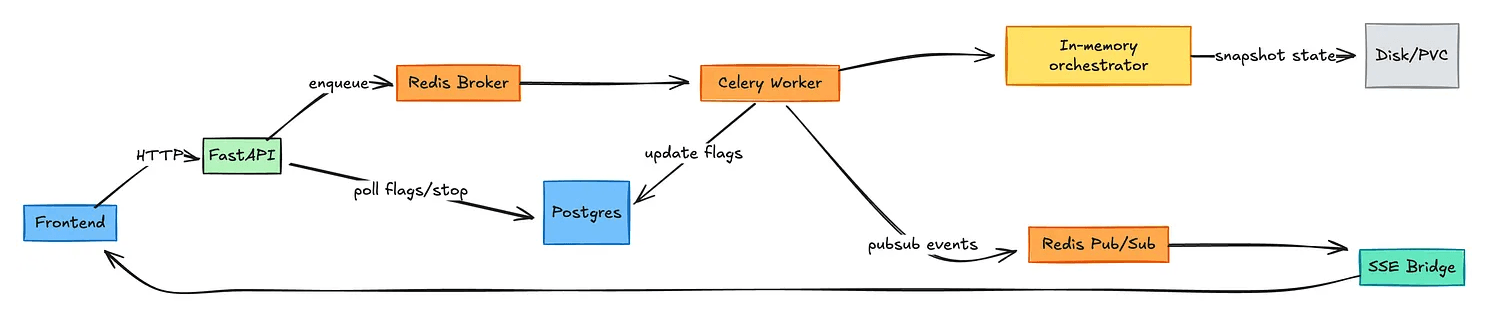
Our initial orchestration stack was typical:
- FastAPI as the API layer
- Celery for background execution
- Postgres flags to track stage/task state
- Redis Pub/Sub → SSE bridge for UI streaming
- A long-running in-memory orchestrator whose state was snapshotted to disk
It worked until we needed real control.
What happened
Users would hit stop in the UI; we’d revoke the Celery task, but the system could end up in split-brain state:
- the worker died mid-stage (or kept running locally)
- the DB still said the agent run was “running”
- the snapshot didn’t match what had already been emitted
- the UI and backend disagreed about what had actually completed
We added an orphan cleanup mechanism, more flags, more timeouts, and more “if this happens, do that.”
But the core issue wasn’t a missing if-statement.
Core Issue
The coordinator’s state lived in multiple places (queue, DB flags, snapshots, event stream). Under crashes and cancellations, there was no single source of truth for what had executed and what was safe to retry, so stop/resume was fundamentally racy.
Why Durable Execution?
Durable execution systems give you a single durable coordinator for long-running agent runs, with step-level retries/timeouts, explicit signals, and an inspectable execution history.
Temporal is a common choice for this class of problem, so we used it as the reference implementation here.
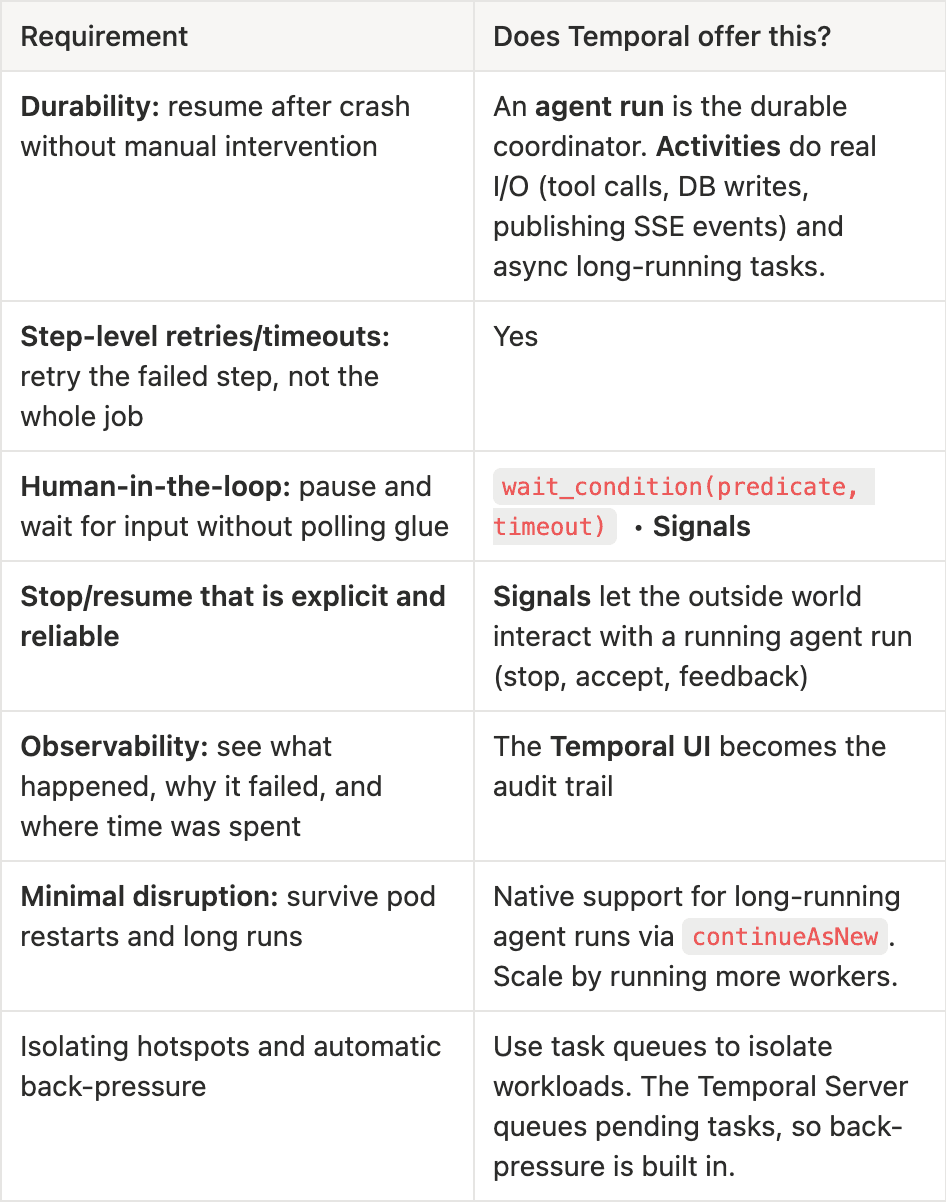
We rewrote our problem as requirements and Temporal mapped cleanly to what we needed:
After the migration:
- Crash recovery: a pod restart resumes from the last completed step instead of restarting the whole run.
- Stop/resume: “stop” becomes an explicit signal with a clear state transition, so UI and backend agree.
- Debugging: execution history is inspectable end-to-end (what ran, what retried, where time went).
- Ops: backlog and schedule-to-start latency become actionable scaling signals.
Operationalizing is where these projects live or die.
Design Decisions That Mattered
Decision 1: Activity Granularity
Go coarse by default, precise where it matters.
Going “one activity per LLM call” maximizes replayable progress, but it also maximizes complexity.
We used a hybrid:
- One activity per stage for most stages (fast migration). Notice the
run_generic_stagestep in the screenshot below
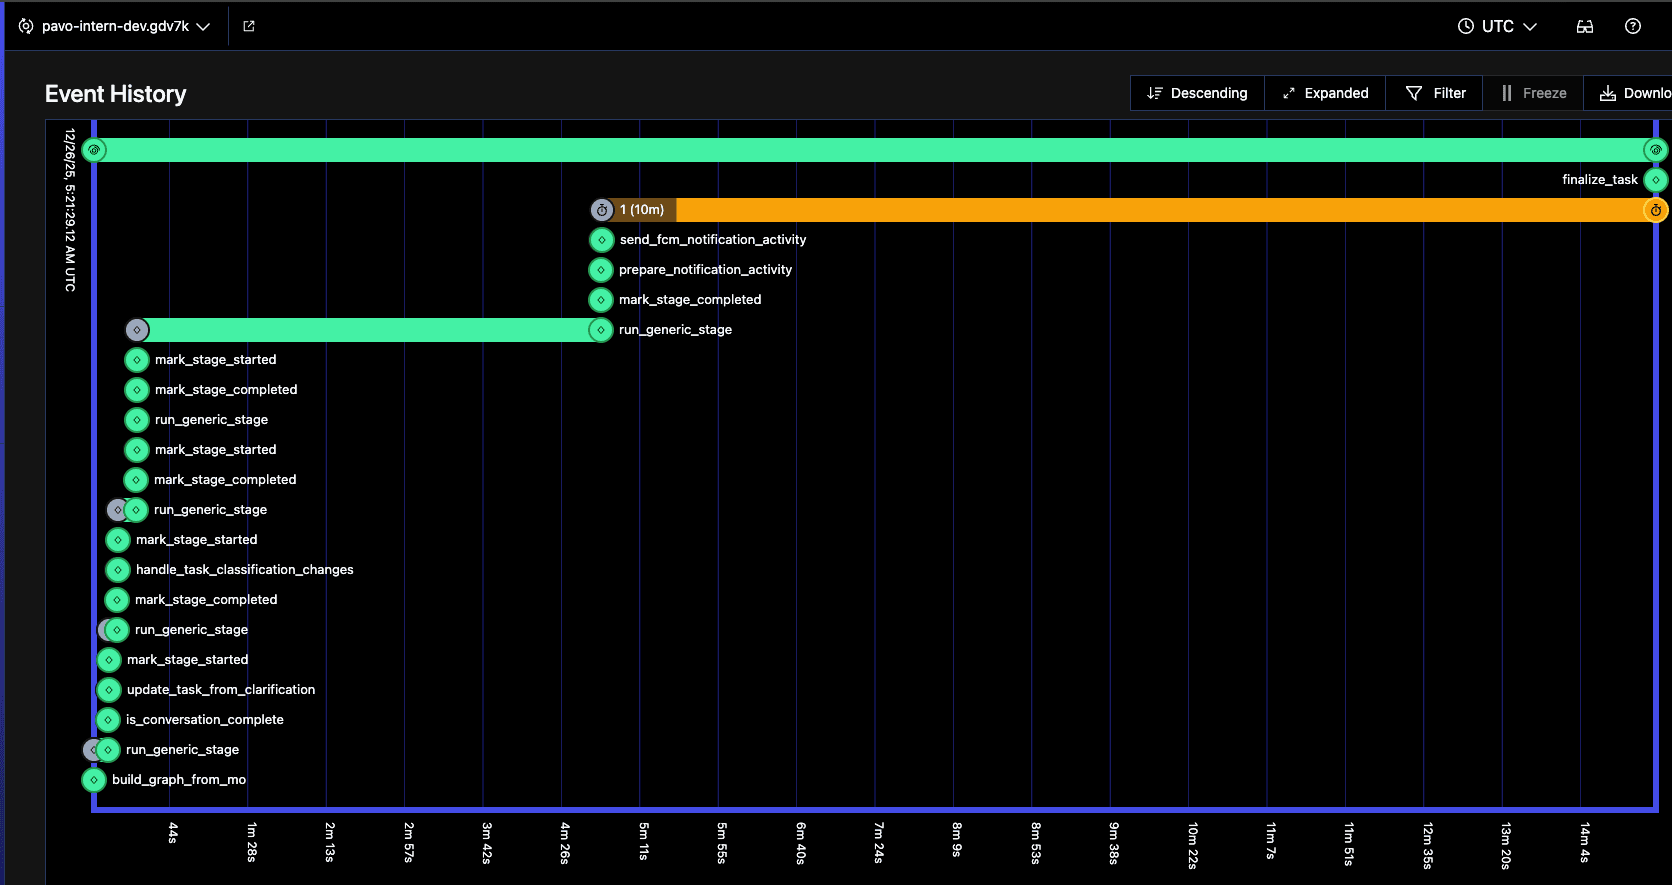
- Special handling for the long agent loop with heartbeats, so a crash can resume mid-loop instead of restarting the entire loop
Decision 2: Make Agent Runs Boring
We made sure the following in our agent runs:
- No time. No network. No surprise imports.
- Keep orchestration logic pure.
- Put all I/O in activities.
Decision 3: Human-in-the-loop… But Humans Reply Late
We discovered reality: users respond after timeouts. If an agent run times out and closes, a late “accept” should not become a support ticket.
Patterns we standardized:
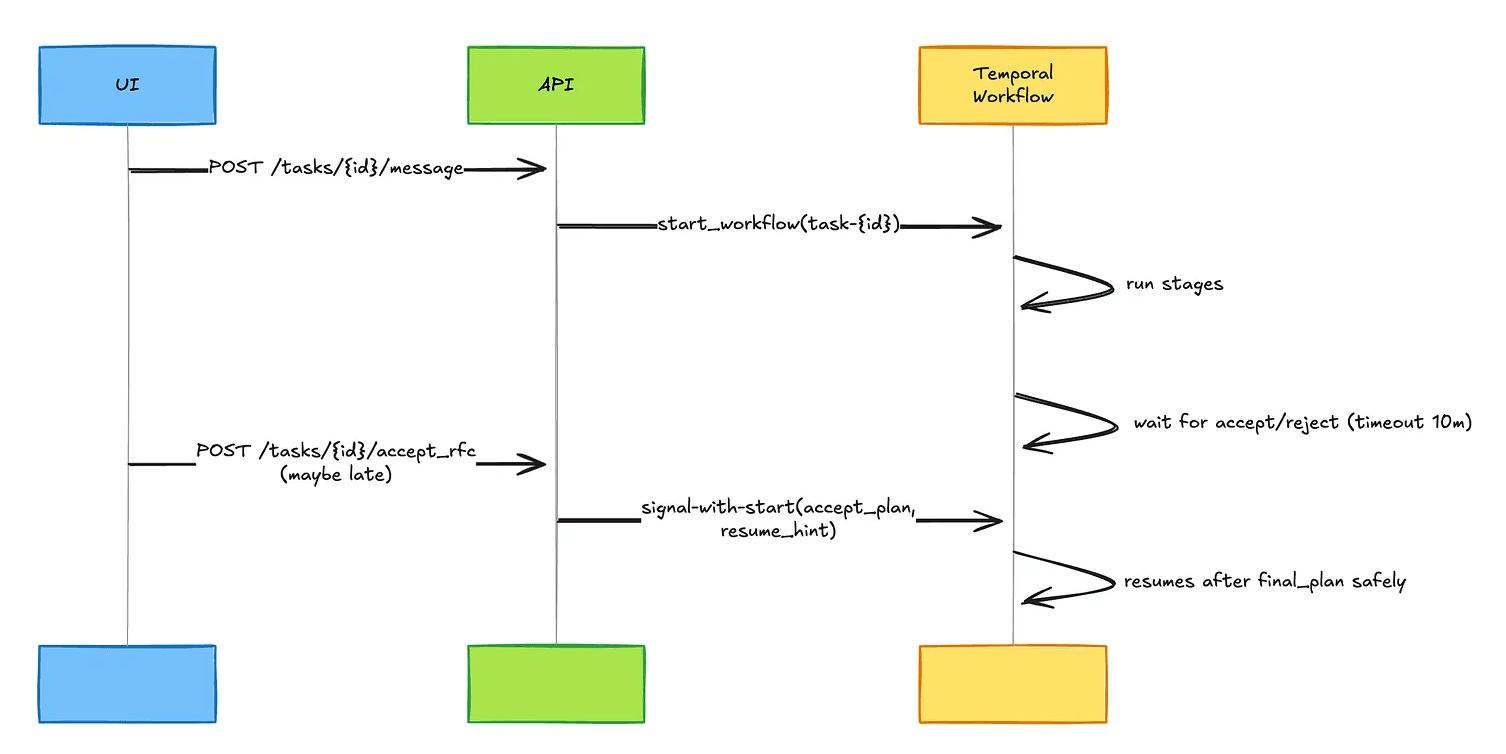
- Agent run waits for accept/reject with a timeout
- If it times out and closes, handle late responses using Signal-With-Start (so a late user action can still resume the agent run)
- Pass a
resume_hintso the new run can continue at/after a stage rather than restarting from the beginning
This also lets us keep agent runs mostly closed (helpful for history growth).
Decision 4: Temporal UI is Necessary, Not Sufficient
Temporal UI is great for execution history. But it doesn’t answer:
- Are workers CPU-bound?
- Are we saturating DB connections?
- Are tasks waiting in queues?
- Is schedule-to-start latency trending up?
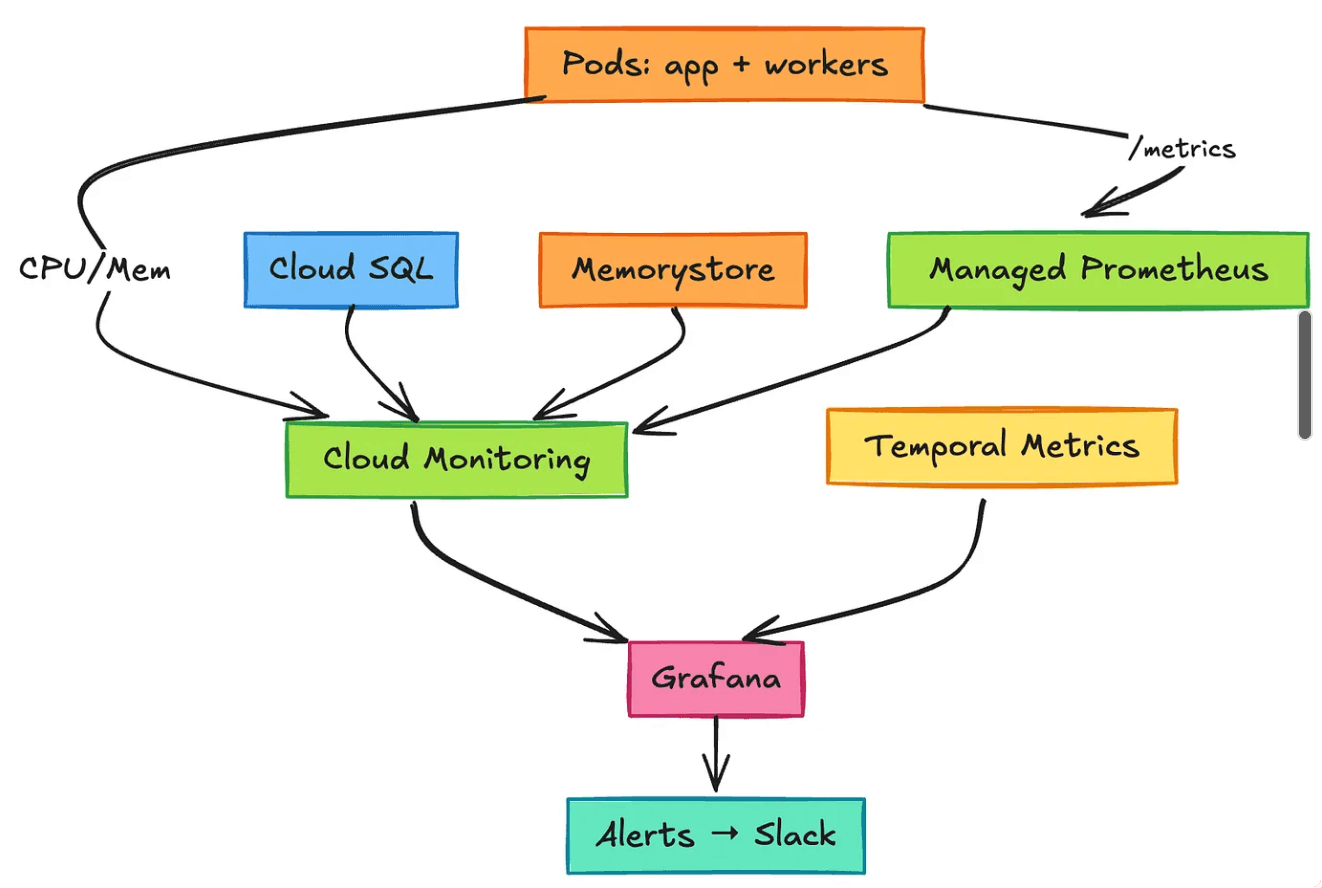
We structured observability into three layers using Grafana:
- Cloud infrastructure metrics (cluster/pods/DB/Redis)
- Temporal metrics (task backlog, pollers, sticky cache, latency)
- Service metrics via
/metricsendpoints
Decision 5: Temporal Cloud vs Self-Hosted
Temporal’s durability comes from a fairly beefy control plane: frontends, history service, matching service, persistence DB (Postgres/MySQL/Cassandra), plus usually a UI/visibility stack and your worker fleet. If we try to drop a separate Temporal cluster into every customer VPC, we’ll be running a mini-distributed system at each client site.
To reduce ops burden, we went ahead with Temporal Cloud.
We used Temporal Cloud to avoid running and upgrading the control plane ourselves. If you can’t use a hosted control plane, self-hosting is viable, but it’s operationally non-trivial.
We also created per-environment (dev and customer-specific) namespaces for isolation.
Worker Tuning
Once orchestration works, the next question is: can it survive load efficiently?
For this, we tuned three things together:
- Worker resources (CPU/mem)
- Worker concurrency knobs (activities/agent runs/pollers)
Observations
Metrics that matter:
- Task Queue Backlog: If 100 Tasks are waiting and each Worker handles 10 concurrent Tasks, you need 10 Workers. Simple math, clear signal.
- Schedule-to-start latency (
activity_schedule_to_start_latency,workflow_task_schedule_to_start_latency): time from scheduling → worker pickup. Rising values mean tasks are waiting in the queue; scale up. - Worker Task slots (
temporal_worker_task_slots_availableandtemporal_worker_task_slots_used): Tell you if Workers are at capacity. Calculate utilization as:(used / (used + available)) * 100.
Requested CPU exceeded 100% so we made CPU Requests = 2 and Limits = 4. Memory is fine.
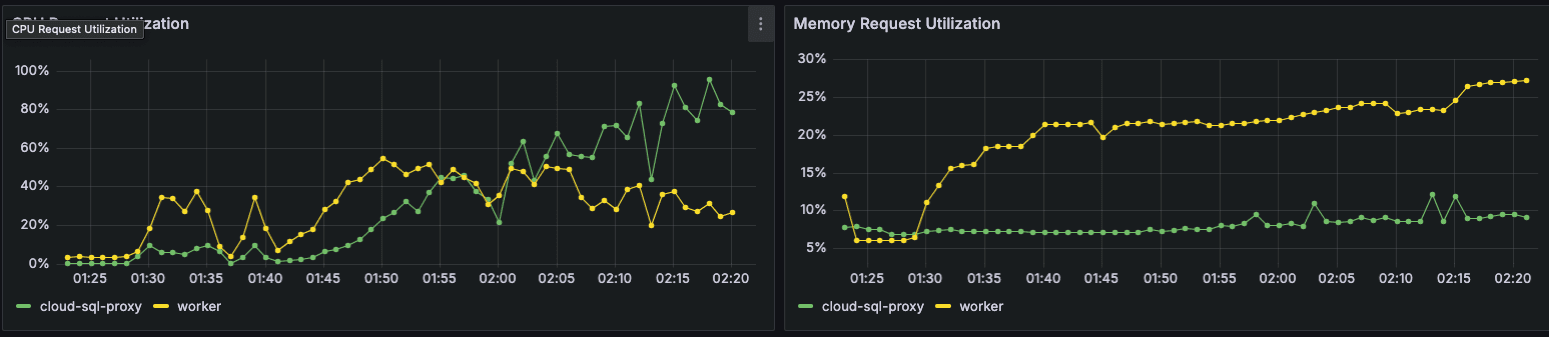
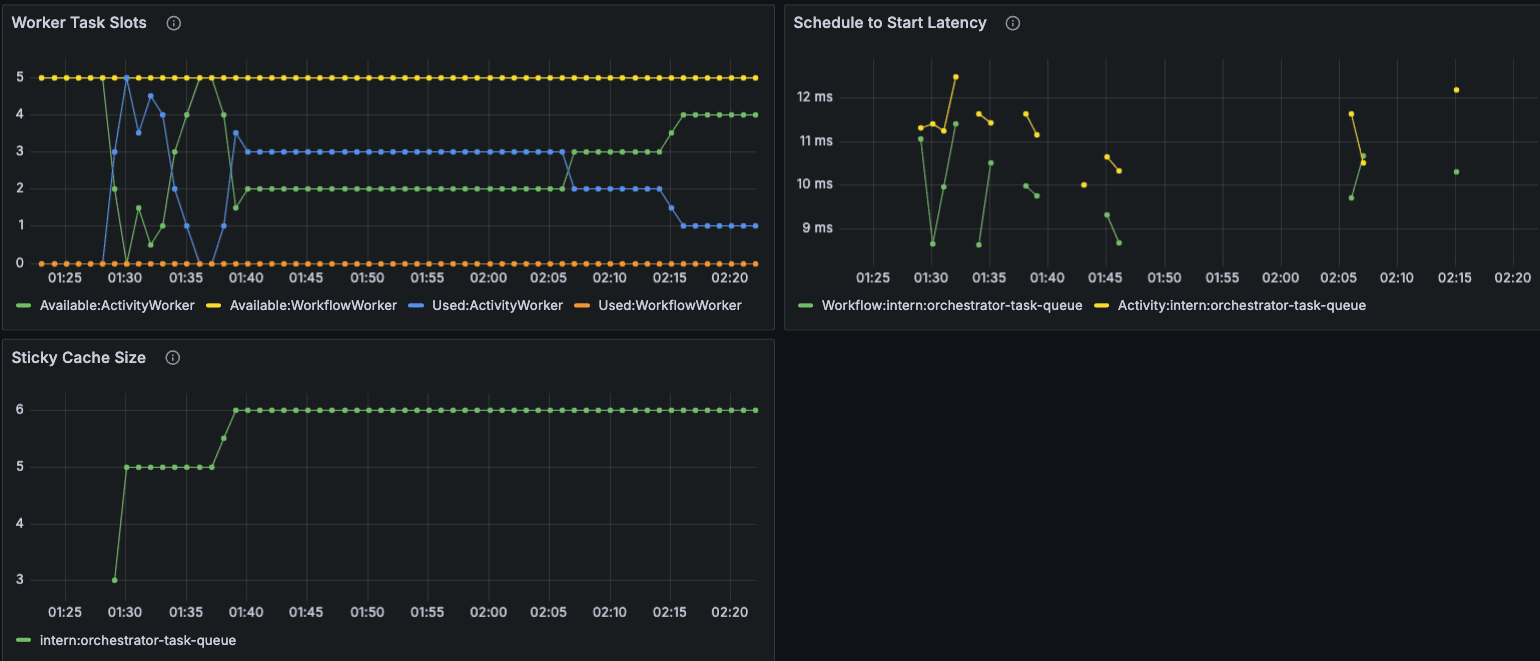
When we increased max concurrent agent runs and activities from 5 → 10, we hit connection errors in our internal Postgres. We reduced it back to 5.
Next Steps
- Integrate Temporal more deeply to support MCP (simple tools and “agents as tools”), and build an agent SDK. Related reading: Building an agentic system that’s actually production-ready
- Long-running agent runs can bloat history; we’ll trying different strategies (
continueAsNew, closure, summarization). - Temporal now supports Keda-based auto scaling for workers. We’ll integrate this.
- Minimize sensitive data in agent-run history, enforce secret hygiene, evaluate encryption/codec strategies, and formalize redaction.